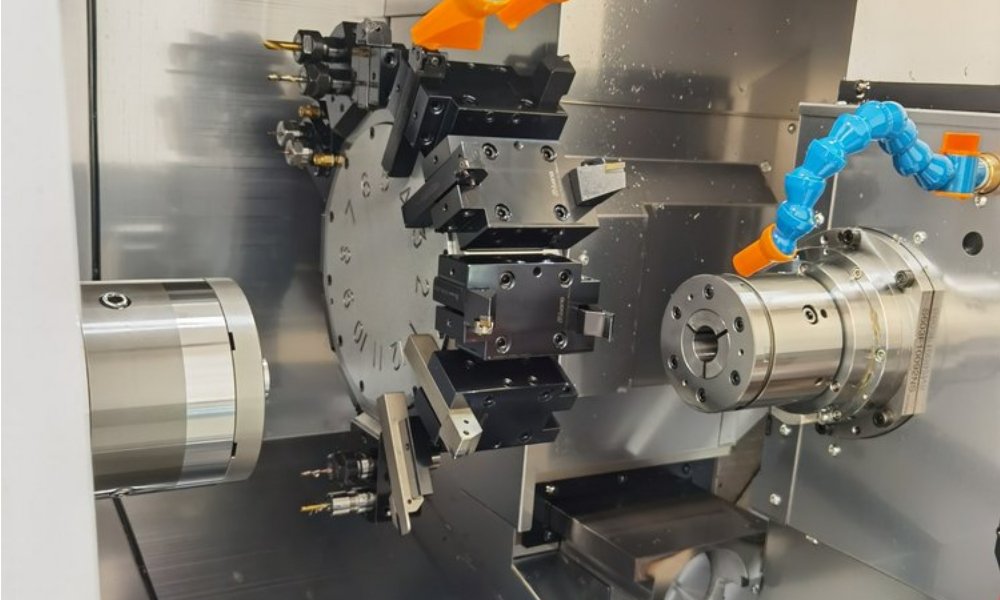
A shop can ship a perfect part and still be one insert change away from a box of scrap. Statistical process control exists to close that gap, and SPC in machining is how a supplier proves it is watching the process, not just the product. Instead of sorting good parts from bad at the end of a batch, SPC tracks measurement variation over time and gives the operator a defined reaction to early drift. This article explains what SPC in machining involves in practice, which dimensions deserve monitoring, and what a buyer should ask before assuming a supplier has its processes under statistical control.
Why SPC in Machining Beats End-of-Batch Inspection
Final inspection answers a backward-looking question: what happened to the parts already made. Control charts answer a forward-looking one: what is the process about to do next. Machining variation has recognizable sources. Tool wear pushes a diameter up by fractions of a micron per part. Coolant temperature shifts machine geometry across a shift. A chip under a fixture changes seating depth for the next setup. Most of these drift slowly, staying inside tolerance for dozens of parts before crossing a limit.
Statistical monitoring catches the motion while there is still room to act. Instead of discovering a drifting spindle when the batch reaches the CMM queue, the operator sees the trend and changes an insert during a planned stop. End-of-batch inspection still has a role, of course. SPC simply shifts most of the work from detection to prevention, which is where the real savings in machining live.
The Core Tools: Control Charts and Rational Subgroups
An X-bar and range chart plots the average and the spread of small groups of consecutive parts, usually two to five pieces measured at planned intervals. Individuals and moving-range charts serve characteristics measured once per cycle, which covers much shop-floor gauging. Control limits are computed from recent process performance, not from the print: they describe what the process is doing, while the tolerance describes what the customer demands. Keeping those two concepts separate is what makes a signal credible.
A point outside the limits, or a suspicious run of points, triggers a written reaction plan. Run rules catch patterns a single point would miss, such as seven consecutive values on one side of the centerline. The reaction matters as much as the chart. The operator needs a defined answer for what to do when a signal appears, whether that is re-measuring, isolating parts back to the last reading in control, or calling a setter.
Choosing the Critical Dimensions Worth Monitoring
Nobody charts everything, and shops that try dilute the discipline to death. In a typical program, the supplier and the customer agree on a short list of key characteristics: bores that control bearing fit, faces that set seal height, the pattern of holes that carries an assembly. Those features get charts. The selection depends on how the print defines each requirement, so buyers and suppliers who read GD&T differently often end up protecting the wrong feature; our GD&T basics for CNC buyers article covers that alignment conversation. Tolerance stack logic helps too, since features at the end of a stack react first to upstream drift, as explained in our CNC machining tolerances guide.
Catching Drift Before It Becomes Scrap
The value of monitoring comes from acting on early signals. Tool wear is the most common pattern: a finish bore creeps upward part by part, and an individuals chart turns that slope into a predictable tool-change schedule. Thermal growth behaves similarly across a shift, which is why careful shops warm up machines and watch first-off readings more closely. Insert lot changes, coolant concentration shifts, and fixture cleaning show up as step changes in the data, and the chart tells you which parts to quarantine, everything since the last reading in control.
Capability work connects here as well. A capability study says how the process performed during its sampling window; a control chart says whether that window was even representative. If the chart shows an unstable process, the capability number is not valid. Both belong in a supplier quality file, and our overview of CNC machining quality control shows how the pieces fit together.
Realistic SPC in a High-Mix Job Shop
Textbook control charts assume long runs, and most job shops run short. That is a real constraint, not an excuse. Experienced shops adapt. In-process gauging measures critical diameters during the cycle and feeds offsets automatically. Post-process sampling puts a handful of parts per setup onto bench gauges. Trend reviews aggregate data by machine and feature rather than by part number, so machine behavior is followed even when individual part numbers are brief. A shop running a forty-piece job can still catch bore drift across setups if the measurement method is consistent.
Honest buyers ask what the shop actually does on difficult work, not what its procedure promises on paper. Request a recent chart tied to a component like yours and check whether a reaction plan is attached. A supplier who pulls a live chart from last quarter is running SPC; a supplier who generates charts only for the audit is staging them. That difference is where SPC in machining separates from documentation.
What to Ask a Supplier About Statistical Control
A short due-diligence list goes a long way. Which characteristics are under statistical control today, and how were they selected? How often are readings taken, by whom, and with which gauges? Has measurement system analysis been done on those gauges? What is the documented reaction plan for an out-of-limit point, and can the shop show one that was actually executed? How are special-cause responses preserved, from tool changes to quarantines? Can charts travel with a shipment when the contract requires evidence? In short, SPC in machining should be visible, specific, and tied to written reactions.
Expect concrete answers, and treat vague confidence as its own signal. On critical programs, nothing replaces an on-site audit of the gauging routine. Aerospace work adds another layer, because AS9100 expects documented process validation and product acceptance; our aerospace CNC machining guide explains what those audits probe.
Do short production runs really need control charts?
They need some statistical view of the setup, even a compact one. A four-piece job rarely justifies a formal chart; a four-hundred-piece campaign usually does. The practical middle ground in job shops is monitoring key characteristics across similar setups so that machine behavior is tracked even when individual orders are brief. The goal is deciding with data instead of habit.
How many parts must be measured for meaningful control?
Subgroups of two to five consecutive parts at planned intervals are standard, and most practitioners wait for roughly twenty plotted points before treating the limits as informative. A brand-new process needs an initial study period before its limits are locked. After that, reading frequency depends on how fast the characteristic is known to drift, and it should be written into the control plan rather than improvised on the floor.
Can SPC replace final inspection?
No. Statistical control judges the process; final inspection judges the parts actually delivered, including cosmetic and assembly requirements a chart cannot see. SPC changes what final inspection is for. With a proven stable process, sampling can lighten and the inspector focuses on attributes and fit behavior. Our surface roughness Ra guide covers an attribute family that charts handle poorly and that inspection must confirm directly.